You need to sign in or sign up before continuing.
EcoQuest Results
AUGUST
The August EcoQuest explored plants and animals associated with monsoon season. It was the hottest summer on record in metro Phoenix and the third driest. We had a "nonsoon," but some great observations were still made. Below are a few articles about this monsoon season cause and effect.
Record Summer Heat Topples Hikers and Cacti
How Monsoons Work
Nonsoon 2020
Somethings to consider reflecting on this EcoQuest: Were the overall number of observations lower because getting out in the extreme heat was overbearing, or were species truly harder to find? What other species impacts did you notice from the extreme heat and no rain? What might the impacts be into the future? What may happen when saguaros finally receive some much needed moisture?
Most Observations: 18 observations by @ecoexplorers
Most Species: 6 species also by @ecoexplorers
Most Observed Species: Creosote (Larrea tridentata) with 19 observations
SEPTEMBER
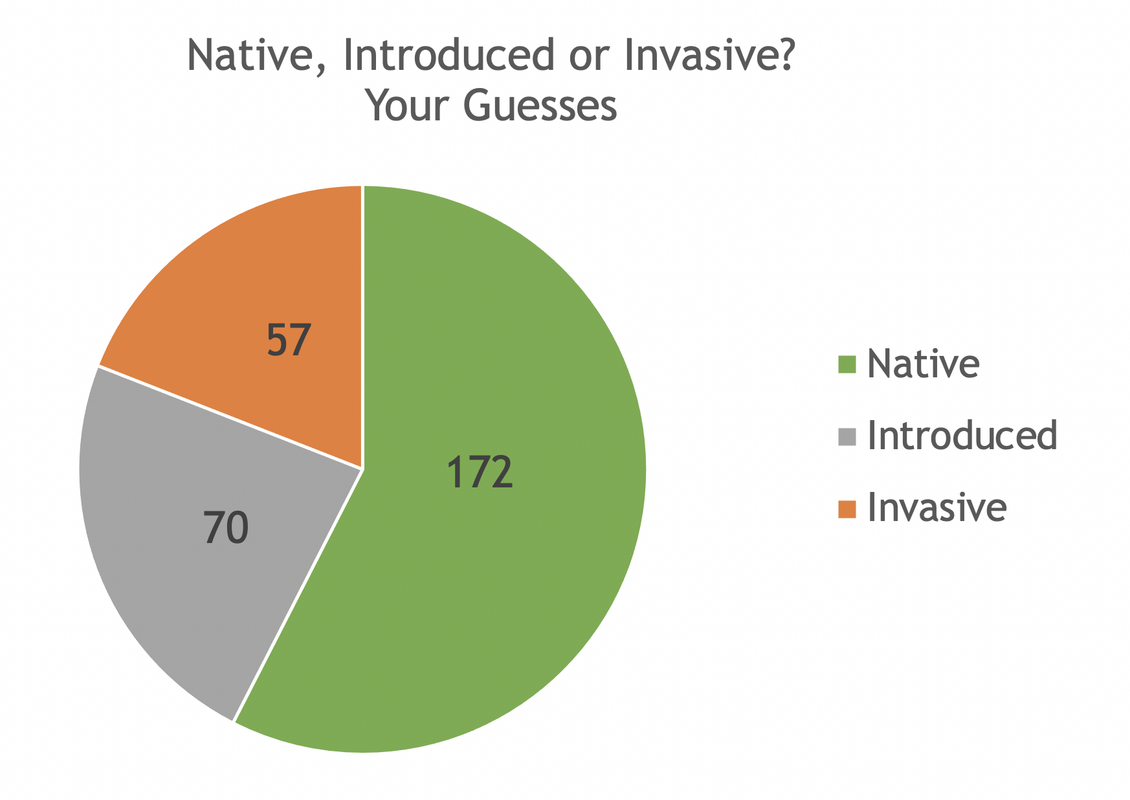
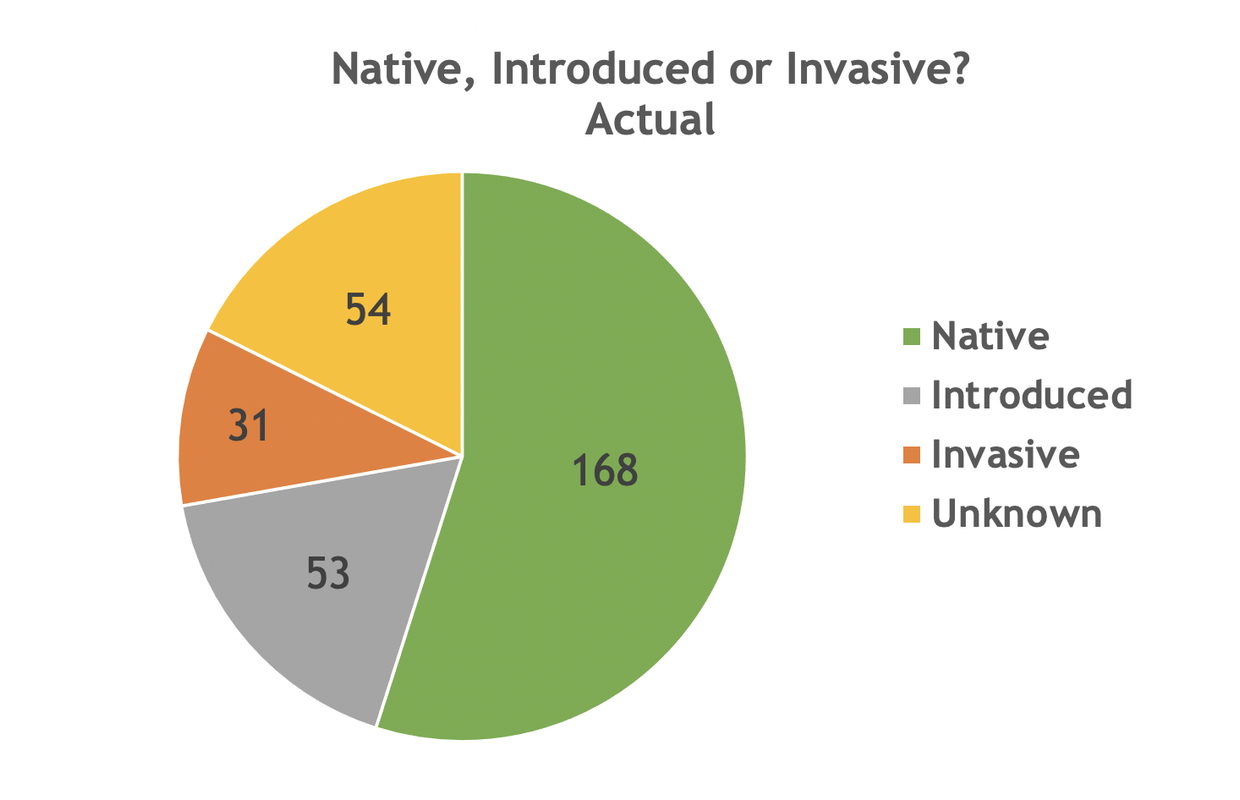
The September EcoQuest explored the labels native, introduced and invasive as applied to plant species. We asked you to guess which label applied to the plants you made observations of. As promised, we are bringing you the final results of the September EcoQuest comparing your guesses and actual, to the best of knowledge and ability. As you may have seen, some plants can seem to fit more than one label. In this case, we looped them in with what official resources tend to state.
Some plants could not be identified to a species level, but could still be categorized based on genus (for example, Tamarix). The "Unknown" category represents plants that could not be confidently identified.
You all did a fantastic job, and made great guesses!
Totals: 307 observations of 146 species by 7 observers.
Most Observations: 174 observations by @larivera, way to go!
Most Species: 70 species also by @larivera.
Most Observed Species: Saguaro (Carnegiea gigantea), Creosote (Larrea tridentata) and Stinknet (Oncosiphon pilulifer) with 8 observations each.
This EcoQuest was a collaboration with Maricopa Native Seed Library.
The library provides free native seed to the community, as well as complimentary workshops, information and consultations about native plant gardening.
Learn more about, find native seed and support the Maricopa Native Seed Library here:
https://libguides.maricopa.edu/seed
OCTOBER
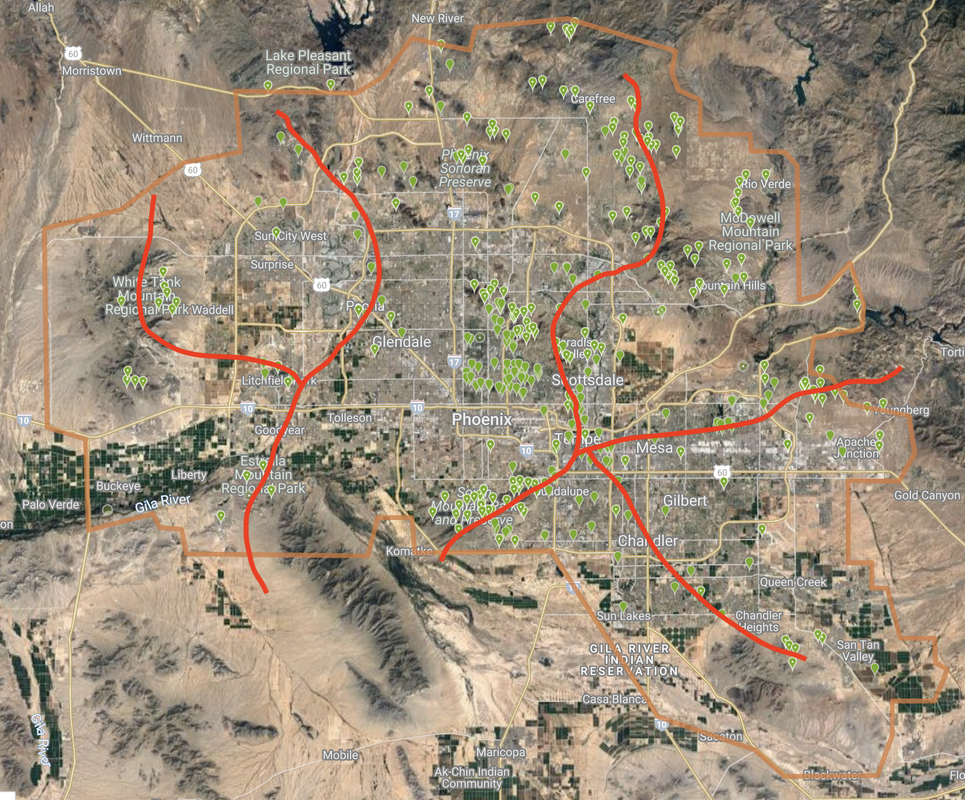
The October EcoQuest searched for ocotillos, with a focus on dense urban areas where data is lacking. These observations can provide information about occurrences, population size and density. Before this EcoQuest, there were 432 observations of ocotillo in Metro Phoenix. With your contributions, there are now 1,056! We gained an impressive amount of observations and combined with existing observations of ocotillo, we can see possible population concentrations, pollinator corridors and nectar sources. In the map below, the green dots are ocotillo observations and the red lines represent possible corridors (notice how the corridors connect to open space). More data is still needed in the West Valley, South Phoenix and the Mesa, Chandler, Gilbert area.
Totals: 623 observations by 30 observers
Most Observations: 167 observations by @donnawalkuski, wow!
@donnawalkuski also tracked her observation trips while bicycling, covering a total of 79 miles. This averages out to about 2 ocotillos per mile. Great work!
Thank you for an incredible amount of observations in October!


Comments
Add a Comment